Dashboard
The Dashboard is displayed in three different dashboards. Expand the drop down menu and select: Real Time Dashboard, Consolidated Dashboard, or Device Dashboard. Every dashboard is arranged by several widgets you can drag from the widget's tab.

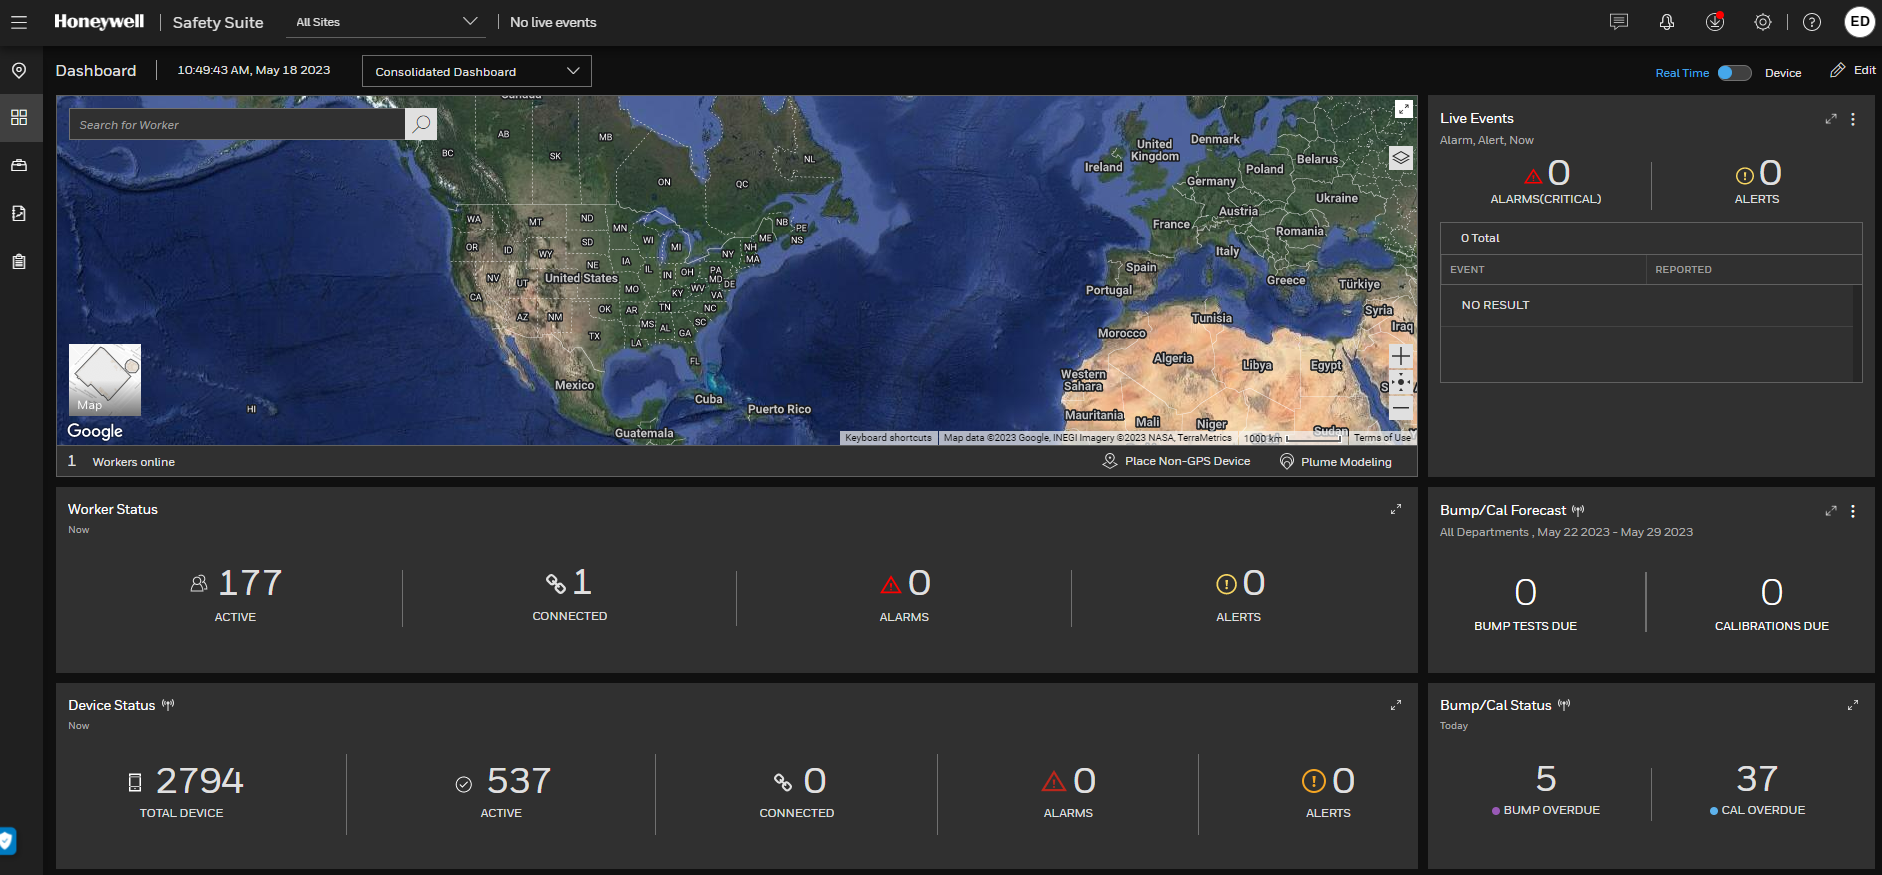
You can perform the following actions in any of the dashboards or widgets:
- Click
 to toggle between Real Time and Device's events.
 - Click
 to customize a widget.
 - Click
 to expand a widget and view detailed info.
 - Click
 to move back to Dashboard.
 - Click
 to select widgets
 - Click
 to modify a widget.
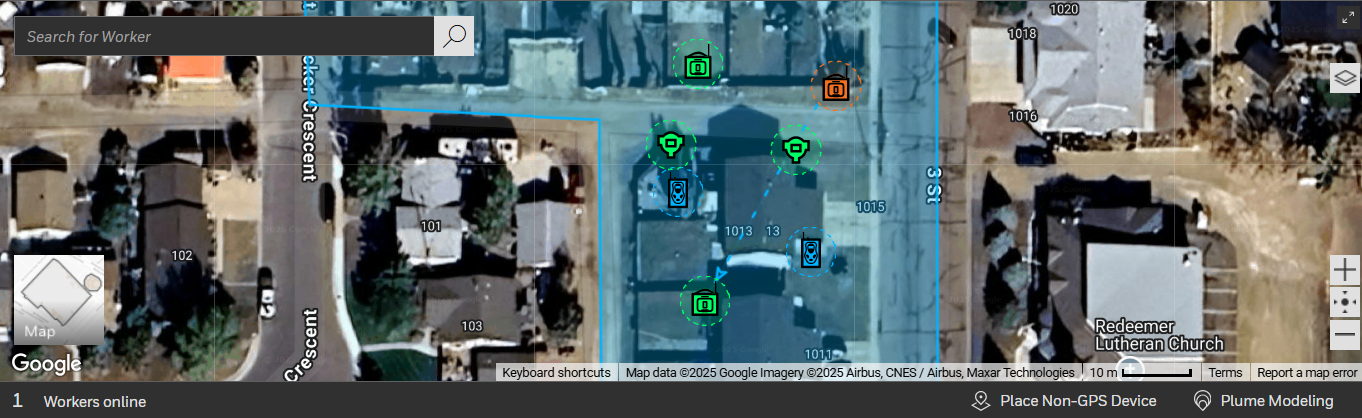
Map
The Map widget displays workers or detectors' location in groups.
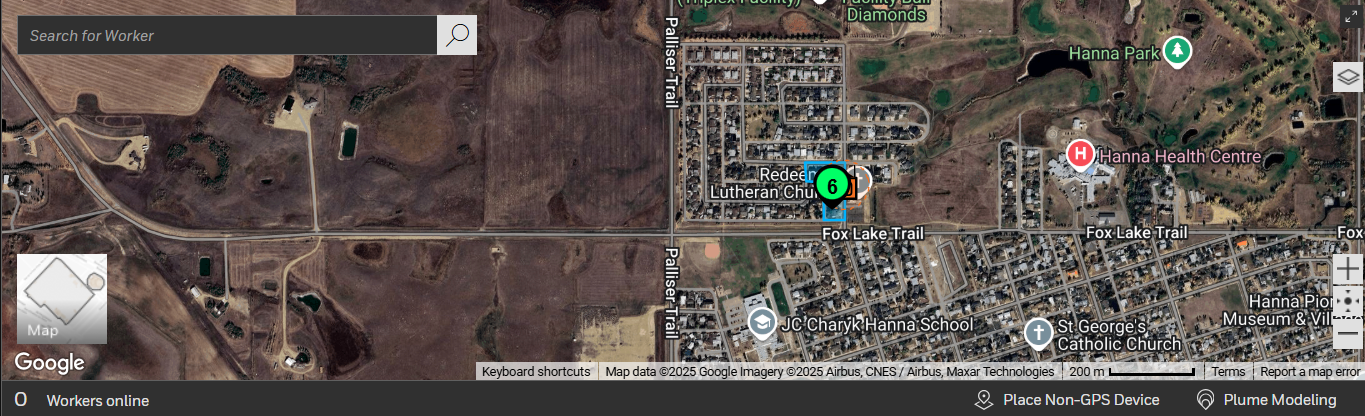
Zooming in ungroups the devices and allows the user to see them individually, as well as the topography between detectors and connectivity devices shown as arrows on the map.
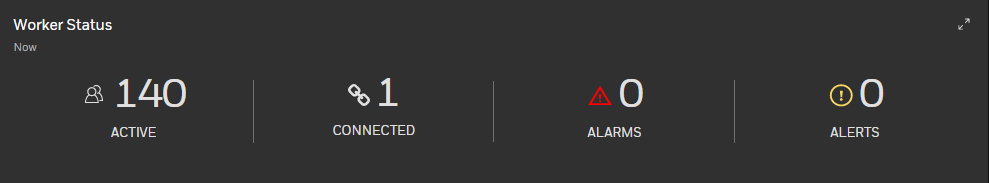
Worker Status
The Worker Status widget displays the workers’ online and event status.
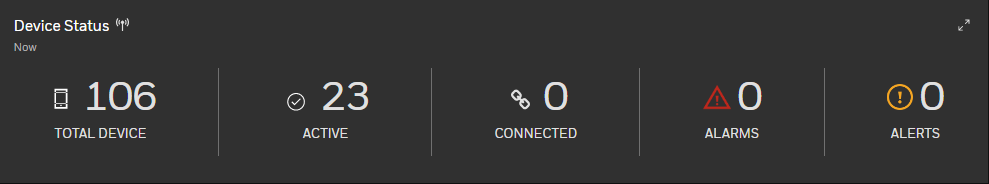
Device Status
The Device Status widget displays devices’ online and event status.
Bump/Cal Status
This widget displays current devices’ bump and calibration status.

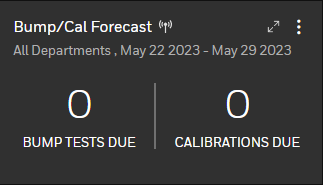
Bump/Cal Forecast
The Bump and Calibration Forecast widget reminds which devices will be expired in a near future.
Live Event
You can see the live Alarm and Alert details on this widget.

Top Events
Top Events widget to show which type of event happened mostly.
Device Data
The Device Data widget (Premium customer only) displays all online devices through wireless.

Data Graph
The Data Graph widget (Premium customer only) displays all online devices’ latest readings by a graph.

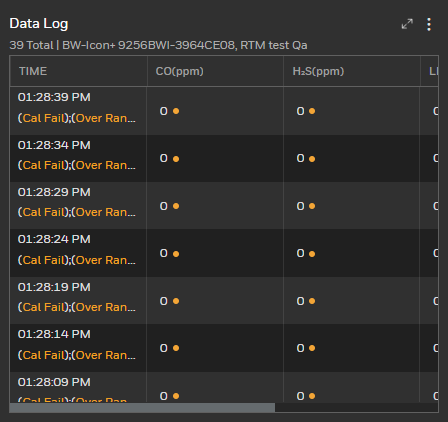
Data Log
The Data Log widget (Premium customer only) displays all online devices’ latest readings by a table.
Past Event
The Past Event widget displays the past details of Alarm and Alert reported on a particular day and Workers' details & Elapsed Time.

Overall Risk
The Overall widget displays the overall risk factor of connected workers.

Click  to set the threshold level.
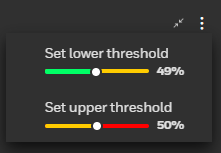
Logic to calculate the number and percentage on overall Risk
- Overall Risk % = (Sum of online worker number in all risk areas) / (total number of online workers)
- Vs 1 hour ago = Risk factor % (now) - Risk factor % (1 hour ago)
Risk Factor
This widget displays the Risk Factor of a worker under different Risks like Explosion, Gas, Dust, Chemical, Height, Noise, Radiation, and Pressure. Each Risk Factor will show how many workers are under risk.
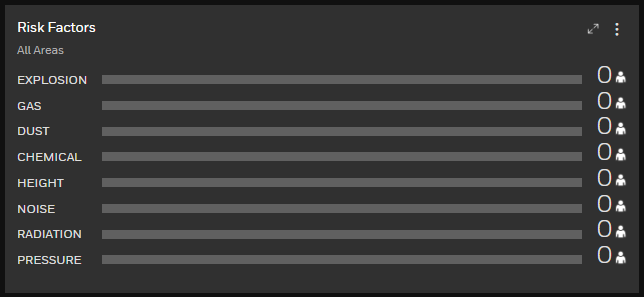
Click  to view the workers risk in % and graph.
Logic to calculate the number and percentage on Risk factor,
- Number of particular risk type = Sum of worker count from areas having that particular risk type.
- % of particular risk type = Sum of worker count from areas having that particular risk type (Number of particular Risk Factor) / the number of online workers who are in risk areas.
For example:
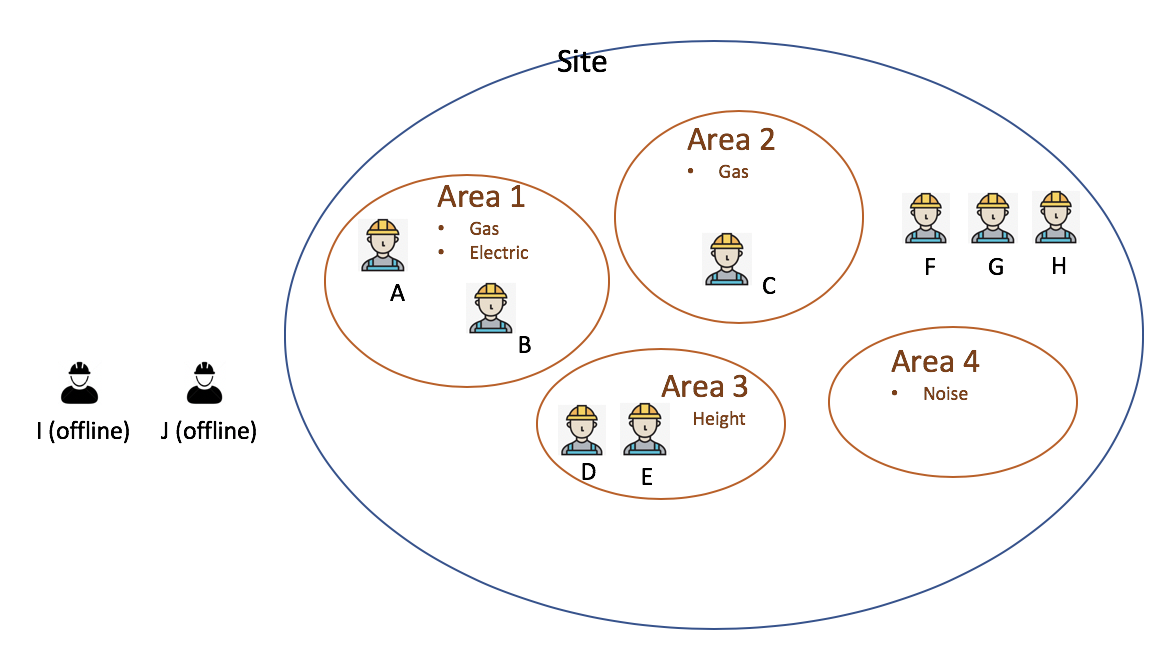
Number on Gas = 3 (A, B,C),% on Gas = 3/5 = 60 %
Number on Electric = 2 (A, B),% on Electric = 2/5 = 40%
Number on Height = 2 (D, E),% on Height = 2/5 = 40%
Number on Noise = 0,% on Noise = 0%
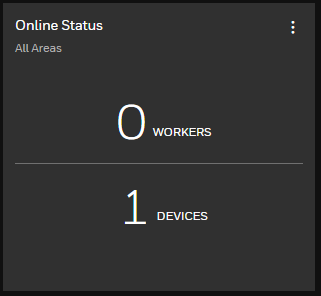
Online Status
The Online Status widget displays the status of the connected Workers and Devices.
Site Areas
The Site Areas widget displays the details about Sites and its Areas.

In above screen, click on any Sites to see more details about sites.
After clicking on sites, below screen will open and it will show the different Areas in selected Site.

To view Areas details, click on any Areas from above screen.
